To read the first part of the article, click here…
Much much much later…
After all the sequencing and genotyping is finally done, it’s time to measure how good the results are. As usual, there is no single, perfect measure for calculating performance. Every measure has a different problem. Let’s go through some of the possibilities!
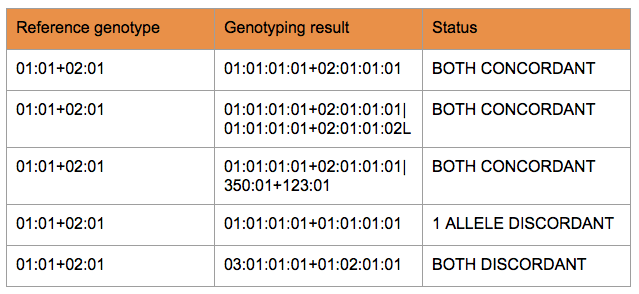
THE INTUITIVE – CONCORDANCE
Concordance is a widely used and easily understandable performance measure that can be calculated on different levels of resolution.
Generally, a reference allele pair and the result can be considered concordant if at least one allele pair from the result was available for which one half of the allele pair matched the first reference allele and the other half similarly matched the second reference allele.
Why do we need more?
- One measure is just one measure.
- Gives no information about the nature of the problem.
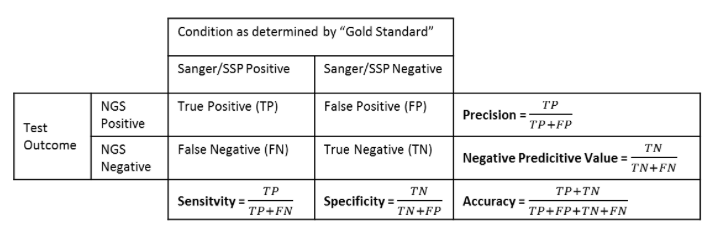
ACCURACY
Accuracy can be defined in as the likelihood of the process finding the “correct” HLA type. In other words, it measures the proportion of true positive and true negative cases compared to all the allele calls made.
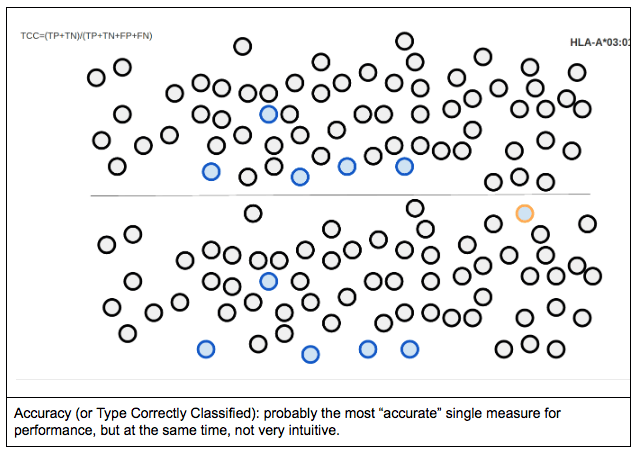
When one tries to represent accuracy for a single allele (in this case, HLA-A*03:01), it would look something like the following figure. Circle borders represent the reference genotype, while circle filling represents the allele call made by the tested genotyping engine. In this case, there are 5 true positive calls for the allele in question (i.e. cases where the allele calls matched the reference) and a single false positive call (when A*03:01 was called, but the expected typing result was something else). Blue/light blue colours represent A*03:01, orange/yellow colours represent A*02:01, while black/grey colours represent the rest of the alleles.
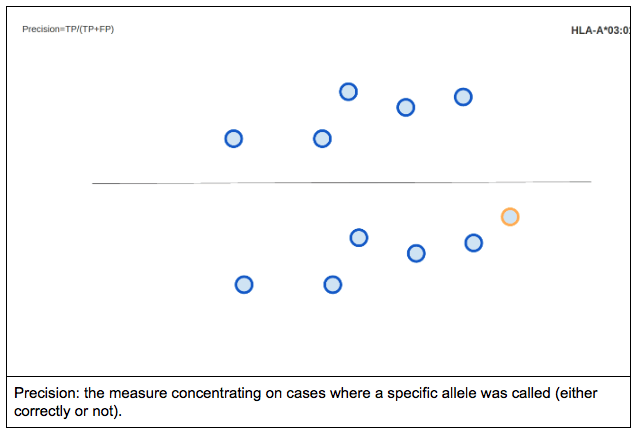
PRECISION
For a binary classification test precision is defined as the proportion of the true positives against all the positive results (both true positives and false positives).
Visualizing precision using the previously described method would look something like this:
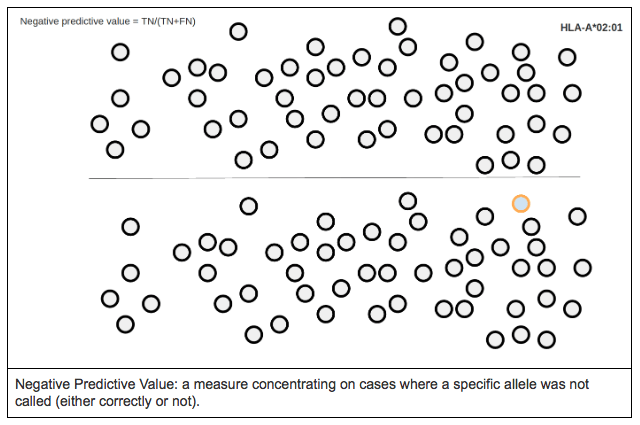
NEGATIVE PREDICTIVE VALUE (NPV)
Negative predictive value is defined as the proportion of true negatives against all the negative results (both true and false negatives).
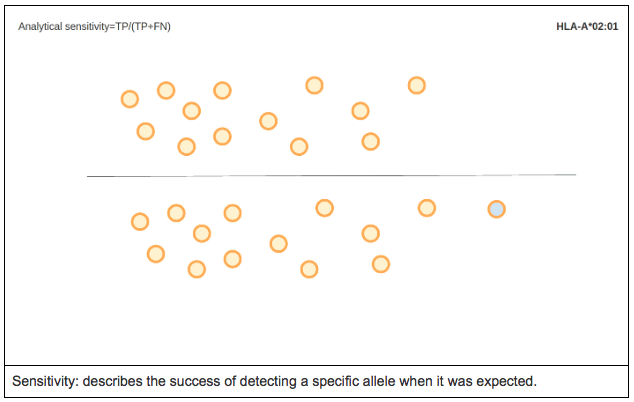
ANALYTICAL SENSITIVITY
Analytical sensitivity is the proportion of true positives called by the software. In other words, it measures the percentage of cases for a specific allele where the expected allele was called.
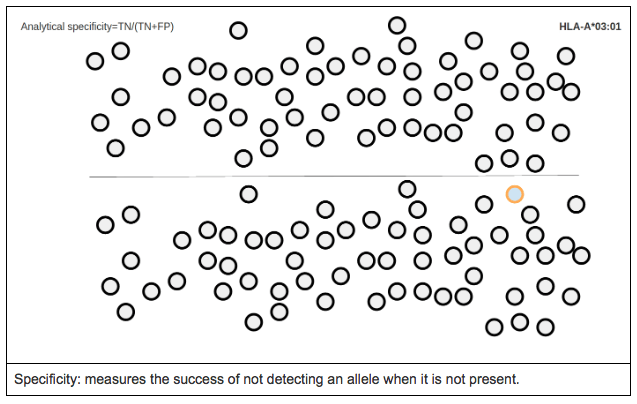
ANALYTICAL SPECIFICITY
Analytical specificity is the proportion of true negative calls for a specific allele (i.e. it measures the proportion of cases where a reference allele was not expected and was not called by the software).
REPRODUCIBILITY
Reproducibility: measures differences between otherwise identical runs of the same sample set where each of the runs were sequenced with reagents from different production lots (e.g. run 1 was sequenced using lot 1 reagents, run 2 was sequenced with lot 2 reagents and soon.)
REPEATABILITY
Repeatability: measures differences between repeats of the same samples within the same run.
Summarizing the results
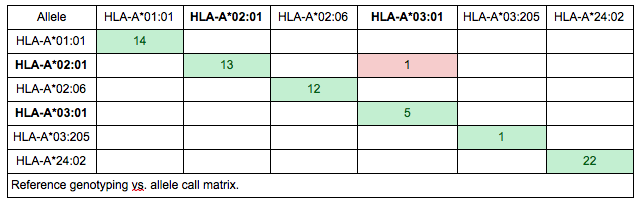
Although it might be tempting to make decisions based on summarized performance measures, it is generally a good idea to look into the details behind the percentages. Probably the easiest way to spot systematic issues is to create a reference vs. genotyping call matrix. This way, the “trends” in mistypings can be observed. E.g. if A*02:01 is mistyped in five cases, it makes a big difference whether it is mistyped as five different alleles or a single allele (e.g. A*03:01).
It can also be a good idea to not limit your analysis to a fixed set of measures. E.g. none of the previously described measures give any information about genotyping ambiguity, even though high ambiguity can make genotyping results literally unusable.
Generally, my advice would be to following:
- keep an open mind (e.g. it is possible that your typing is correct and the reference is wrong)
- when in doubt, look at the raw results
- try to get independent confirmation for problematic cases
- don’t forget the big picture
- try your best to measure only and exactly what you want to measure
*This section is largely based on the following article:
Ng, J. et al. (1993), Large-scale oligonucleotide typing for HLA-DRB1/3/4 and HLA-DQB1 is highly accurate, specific, and reliable. Tissue Antigens, 42: 473–479. doi: 10.1111/j.1399-0039.1993.tb02191.
– By Krisztina Rigó