Text output
Both FastQC and PRINSEQ can generate some basic statistics for each fastq file. For FASTQC these are the following: “Total Sequences” (i.e. the number of reads), “Filtered Sequences”, “Sequence Length” (read length range) and “%GC” (average GC-content). Additionally, tables for “Overrepresented sequences” and “Kmer content” are generated. PRINSEQ calculates the following measures:
- stats_info: number of bases, number of reads;
- stats_len: minimum, maximum, range, mean, standard deviation, mode and mode value, and median for read length;
- stats_dinuc: dinucleotide odds ratio for AA/TT, AC/GT, AG/CT, AT, CA/TG, CC/GG, CG, GA/TC , GC and TA;
- stats_tag: probability of a tag sequence on both ends, number of predefined MIDs;
- stats_dup: number of exact duplicates, 5’ and 3’ duplicates, reverse complement duplicates, total nr. of duplicates;
- stats_ns: number of reads containing N, maximum number and percentage of N/read.
Graphical output
FastQC generates the following graphs:
- Per base sequence quality
- Per sequence quality scores
- Per base sequence content
- Per base GC content
- Per sequence GC content
- Per base N content
- Sequence Length Distribution
- Sequence Duplication Levels
- Kmer Content
The standalone version of PRINSEQ generates the following types graphs:
- Length Distribution
- GC Content Distribution
- Base Quality Distribution
- Occurence of N
- Tag Sequence Check
- Sequence Duplication
- Sequence Complexity
- Dinucleotide Odds Ratios
As an exhaustive user manual and example datasets are available for both tools, I won’t present every graph from every tool, just some examples.

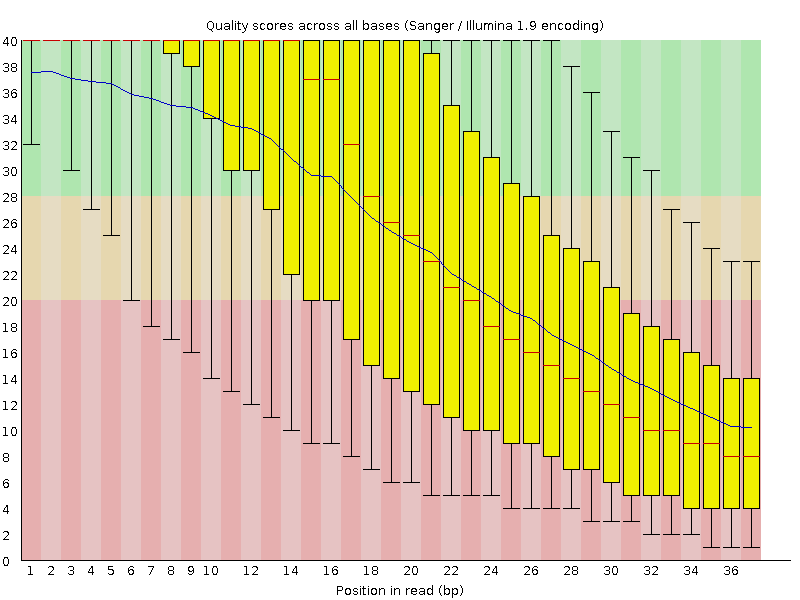
Per base sequence quality graph of one of the Illumina read files, generated by FastQC. Note, that this is a very early sequencing run (from 2008), the general
quality of the newer Illumina reads is usually around 33-35, or even higher. Of course, the read length improved significantly since 2008 too.

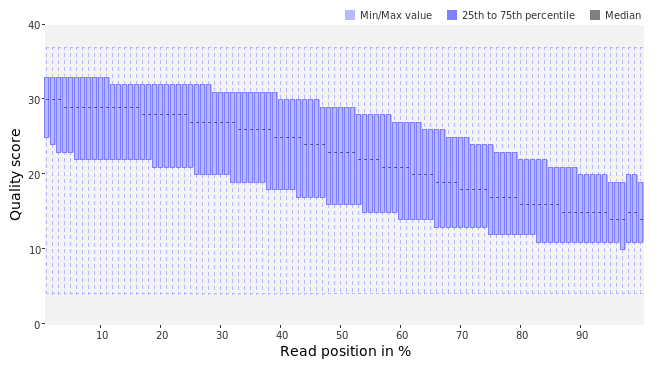
Per base quality graph of the IonTorrent fastq file, generated by PRINSEQ. Nowadays, Ion Torrent reads usually have a slightly lower quality than Illumina or 454 reads.

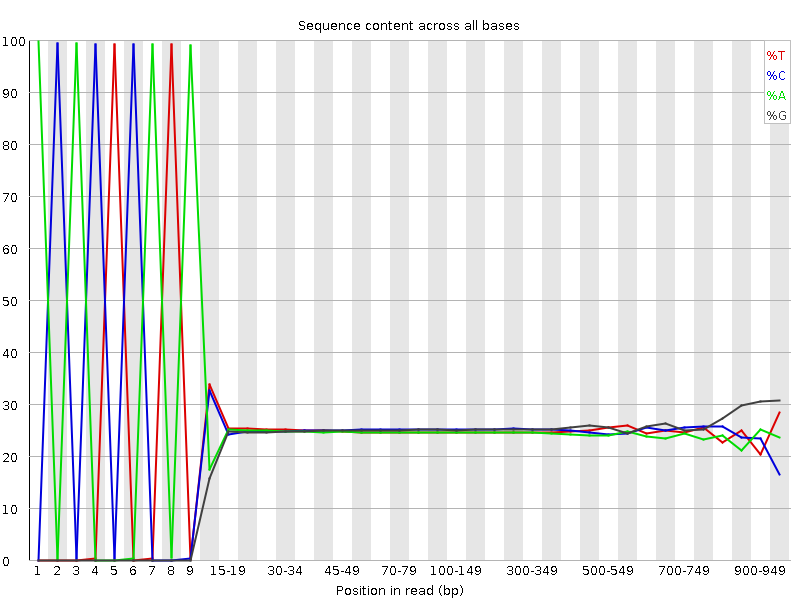
Per base sequence content of the 454 read file. You can easily spot, that the first 8-10 bases of all the reads are exactly the same. This usually happens, when the adaptors are not trimmed. The last few bases seem a little biased too, but that’s usually due to the lower number of long reads (basically, this is kind of like a sampling error: the higher base positions are represented by much less reads than the base positions in the beginning or middle).
